

Black Friday is sold as a saving, but it is really a spending event with a discount attached. The more useful question is not how much a deal takes off the price, but what that money would have become if you invested it for future you.
Key takeaways
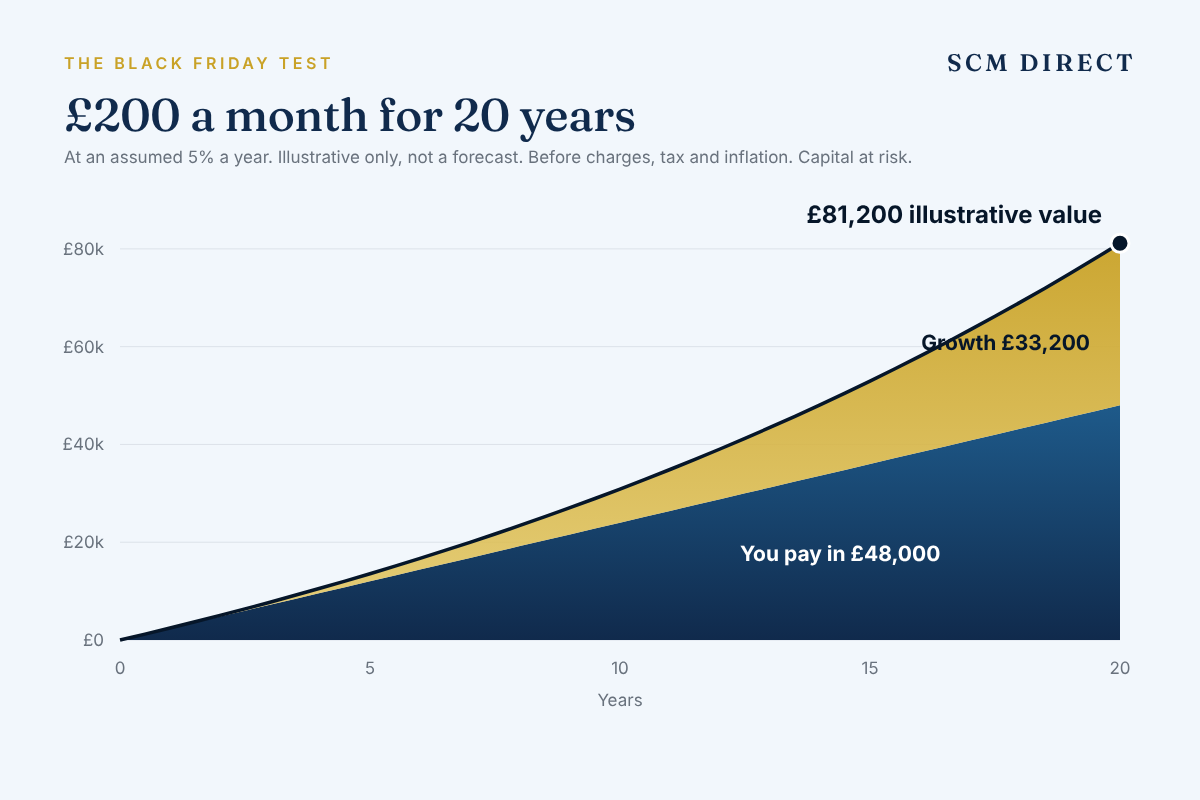
- £200 a month for 20 years means £48,000 paid in. At an assumed 5% a year before charges, it could be worth around £81,200 (illustrative, not a forecast).
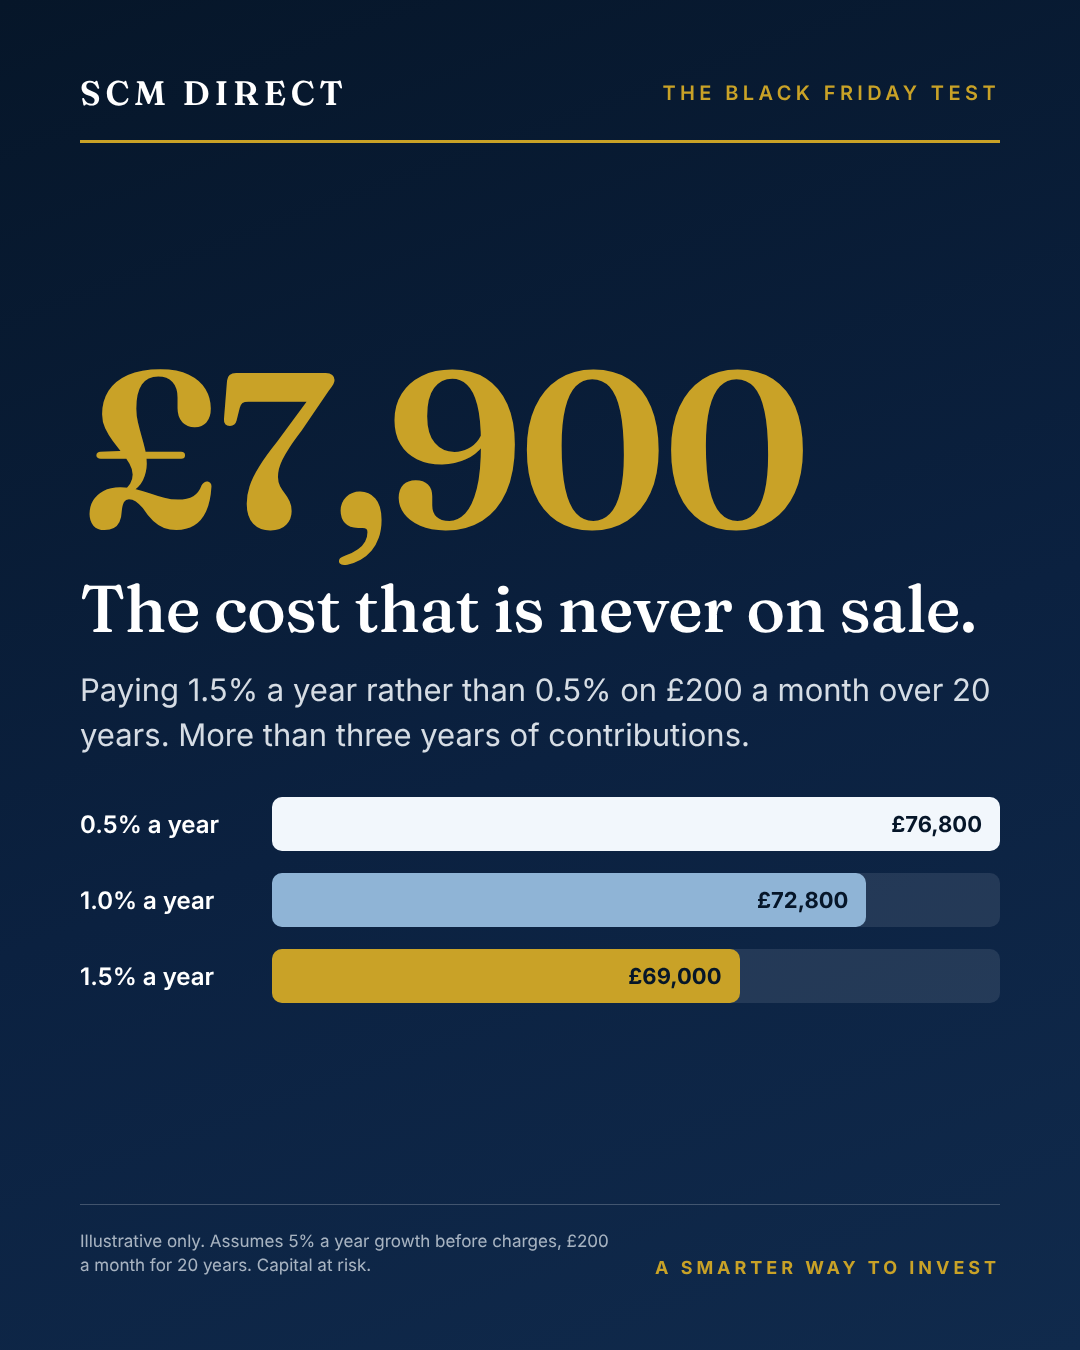
- A one percentage point difference in annual charges could cost around £7,900 over the same period.
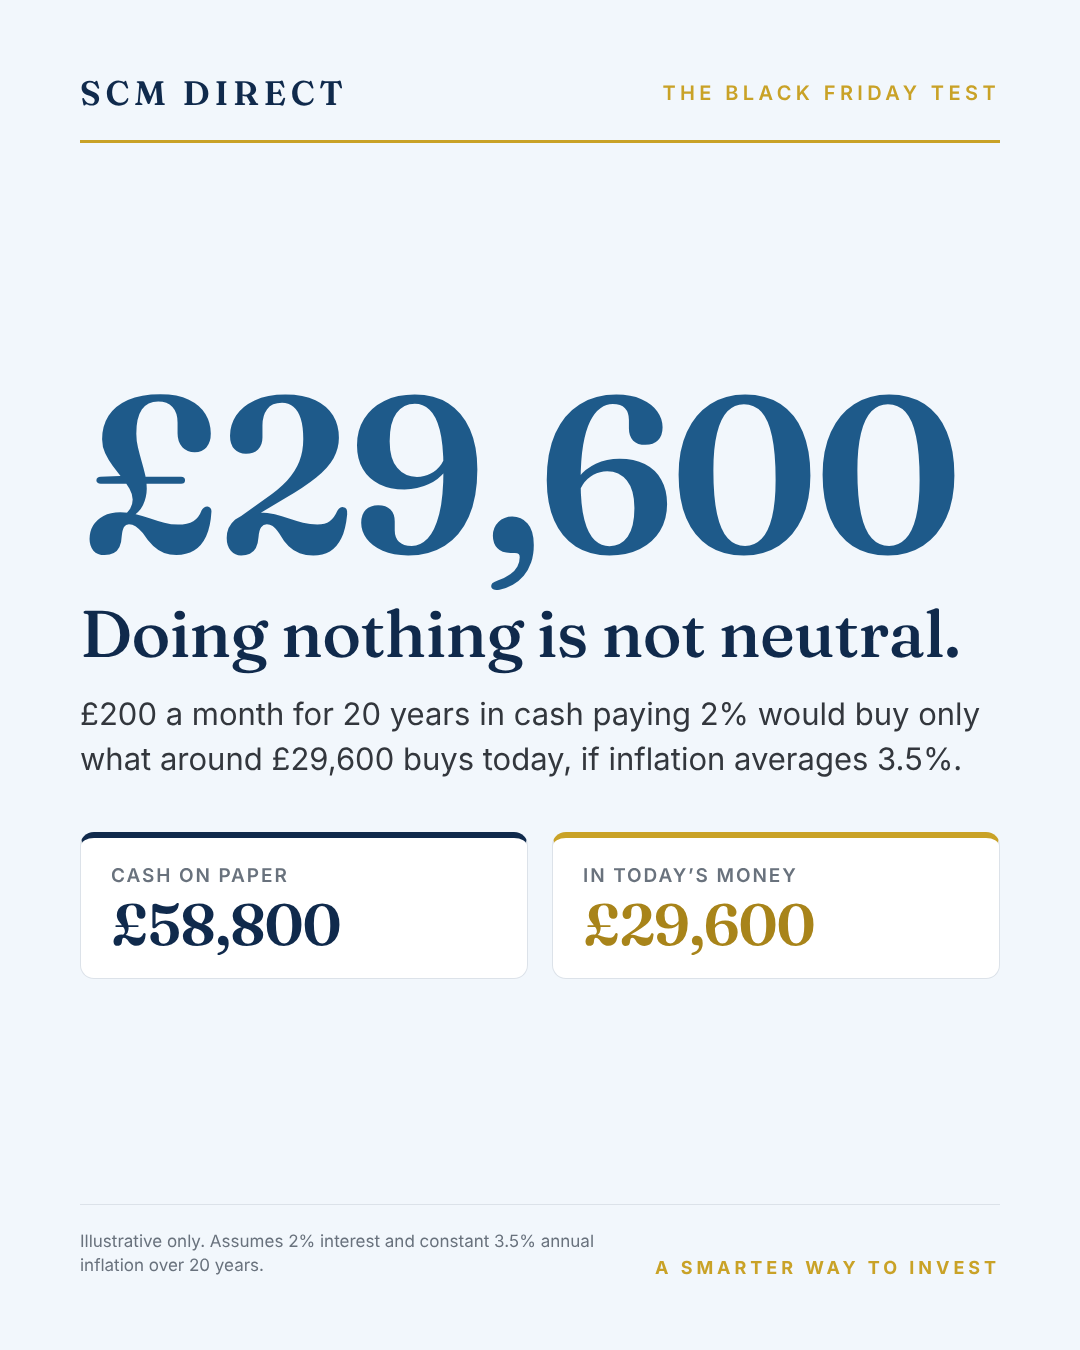
- Cash earning 2% while inflation averages 3.5% loses buying power: £48,000 saved would buy only around £29,600 in today’s money.
- Before any Black Friday purchase, ask: would I buy it at full price, and what could this money be worth in 20 years?
The price tag you are not shown
Every purchase has two prices. One is on the label, and the other is what economists call the opportunity cost: what the same money could have done instead. Retailers are experts at drawing you towards the first: the countdown clock, the crossed-out “was” price, and the warning that stock is running low exist to make sure you don’t think about the second.
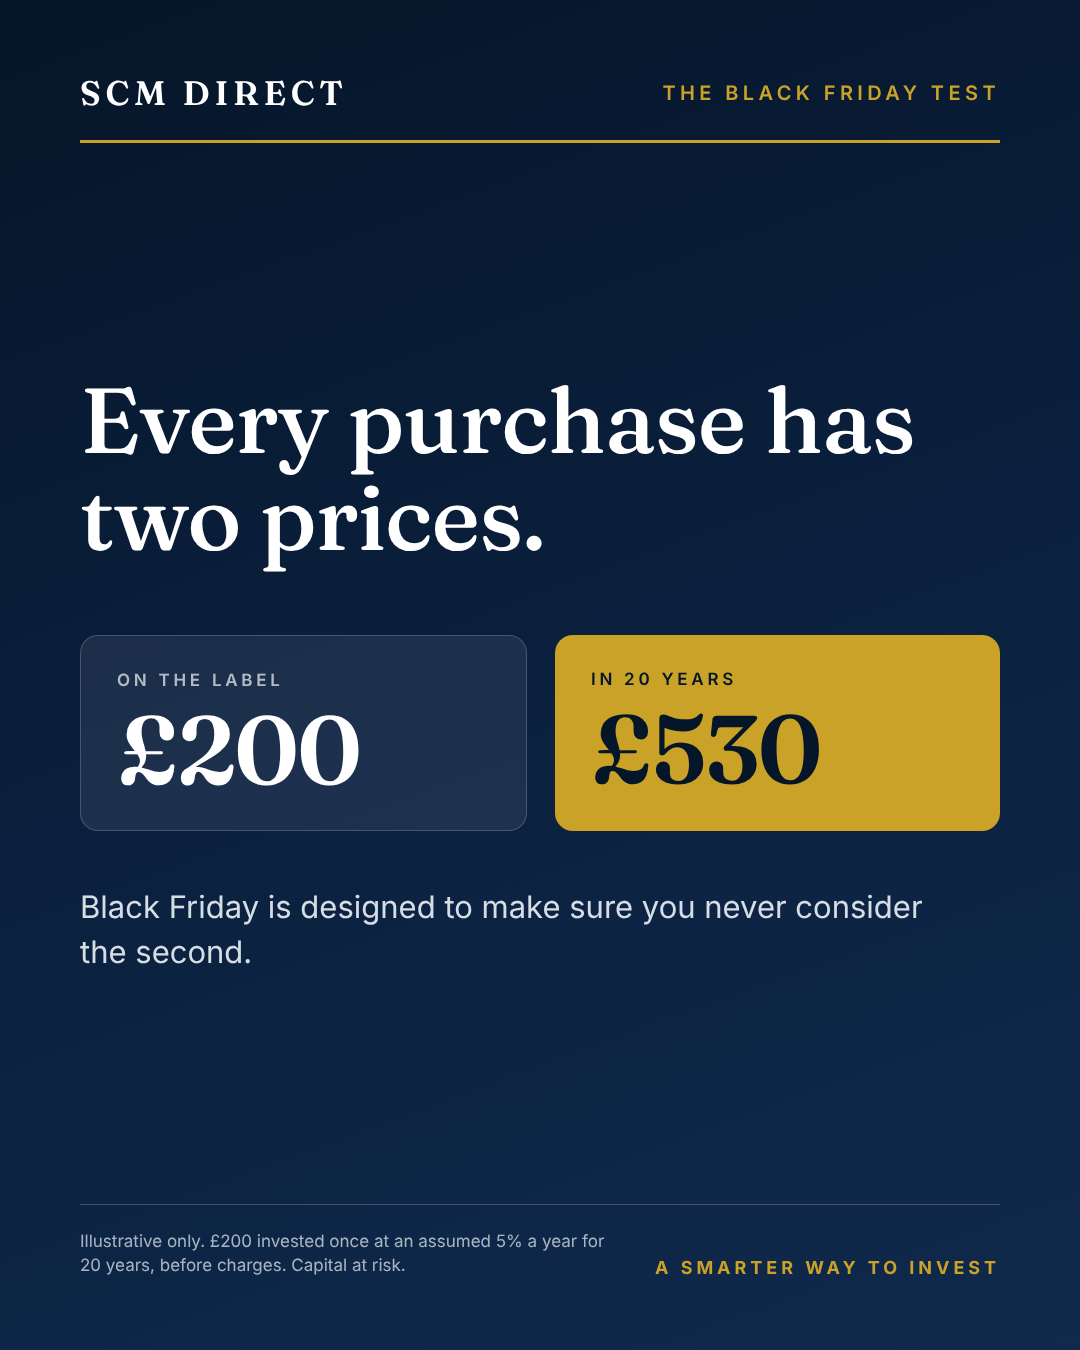
So, before you check out this Black Friday, try a simple test: price the purchase in years, not pounds. £200 invested once and left for 20 years would be worth around £530, assuming 5% growth a year before charges. That is the real cost of the impulse buy. The more revealing picture, though, comes from the habit.
£200 a month, for twenty years
Suppose that instead of going on deals, gadgets and things that will be in a drawer by spring, £200 went into an investment portfolio every month for 20 years. You would pay in £48,000. What it becomes depends on returns, which no one can promise, but the table shows three illustrative growth rates.
| Assumed growth a year | You pay in | Illustrative value after 20 years | Of which growth |
|---|---|---|---|
| 2% | £48,000 | £58,800 | £10,800 |
| 5% | £48,000 | £81,200 | £33,200 |
| 8% | £48,000 | £113,800 | £65,800 |
Illustrative only, not a forecast. Assumes £200 invested at the end of each month for 20 years at a constant annual growth rate, before charges, tax and inflation. Real returns vary from year to year and can be negative. Figures rounded to the nearest £100. Source: SCM Direct calculations.
The difference between the rows shows the power of patience. Compounding is slow, then sudden. At 5% a year, it takes 15 years for growth to add more to the pot in a single year than your own contributions. By the twentieth year, growth adds around £3,800 against the £2,400 you put in. Roughly 40% of the final figure is money you never paid in.
The table makes a less comfortable point too. On identical contributions, the gap between 2% and 8% is around £55,000. Returns matter enormously, and they are the one thing an investor cannot control. That is precisely why it pays to be rigorous about the things you can.
Time in the market matters as much as the monthly sum. An investor able to use a full ISA allowance (currently £20,000 a tax year) as a lump sum, then add £200 a month from the following tax year, would change the picture considerably.
| Assumed growth a year | You pay in | Illustrative value after 20 years | Of which growth |
|---|---|---|---|
| 2% | £68,000 | £88,600 | £20,600 |
| 5% | £68,000 | £134,200 | £66,200 |
| 8% | £68,000 | £207,000 | £139,000 |
Illustrative only, not a forecast. Assumes a £20,000 lump sum invested at the start, then £200 at the end of each month for 20 years, at a constant annual growth rate, before charges, tax and inflation. Because the ISA allowance applies per tax year, the monthly payments begin in the following tax year. Figures rounded to the nearest £100. Source: SCM Direct calculations.
The monthly contributions are identical. The difference is the head start: at 5% a year, the £20,000 lump sum alone could grow to around £53,000, more than doubling over the period.
The cost that is never on sale
Charges are the clearest example. They are taken every year, whatever markets do, and they compound against you just as returns compound for you. Take the middle scenario, 5% a year, and apply three levels of total annual cost.
| Total annual charges | Illustrative value after 20 years | Cost compared with 0.5% |
|---|---|---|
| 0.5% | £76,800 | – |
| 1.0% | £72,800 | £4,100 |
| 1.5% | £69,000 | £7,900 |
Illustrative only. Assumes 5% a year growth before charges, less the total annual charge shown, with £200 invested monthly for 20 years; before tax and inflation. Source: SCM Direct calculations.
A single percentage point in charges costs around £7,900: more than three years of contributions.
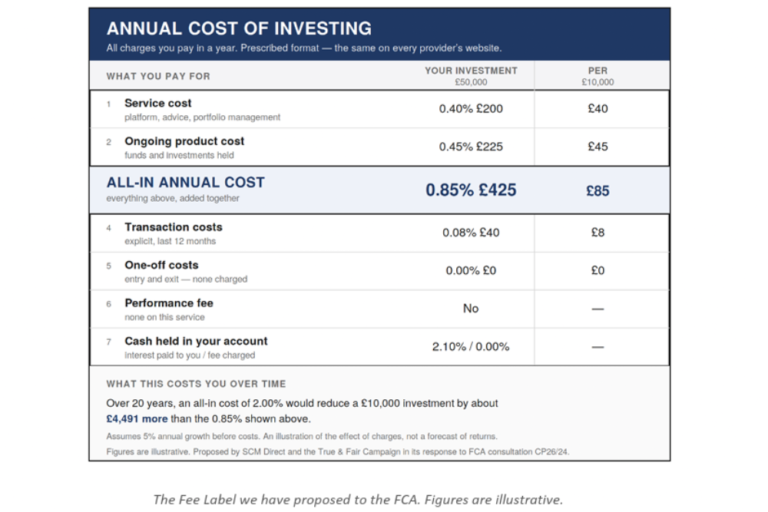
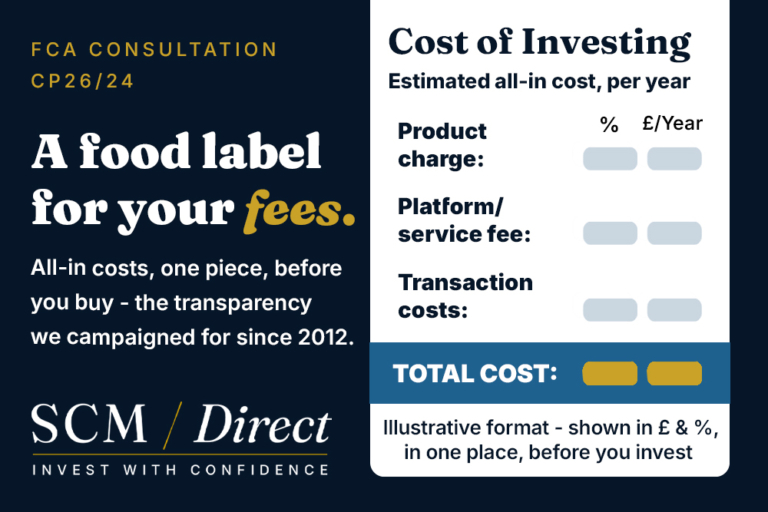
Unlike a Black Friday discount, that figure never appears in large red type. It is why we have argued, through our True and Fair Campaign since 2012, that every investor should be shown the full cost of investing in pounds and pence, not scattered across percentages in several documents.
Doing nothing is not neutral
It is tempting to treat inaction as the safe option: neither buy the deal nor invest. When interest rates are higher, cash can even look competitive, and for short-term money it has its place.
Over 20 years, though, the test is whether savings keep pace with prices. Money that earns nothing does not. If inflation averages 3.5% a year, £48,000 left in an account paying 2% interest would, after 20 years, buy only what around £29,600 buys today. The 5% illustration above would be worth around £40,800 in today’s money: still well ahead of cash.
Not investing is also a decision, and it has a price.
Applying the test
- Would you buy it at full price? If the honest answer is no, the discount is the product.
- Price it in years. Before a significant purchase, ask what the money could be worth in 10 or 20 years. “Saving £50” reads very differently afterwards.
- Pay your plan first. Set a monthly contribution to leave your account the day after payday. What remains is what you spend, sales included.
- Use the tax wrappers. Growth inside a Stocks and Shares ISA or a pension is sheltered from UK tax. Using your ISA allowance every year is one of the simplest advantages for a UK investor.
- Ask what you pay. Every charge, in pounds, every year. If a provider cannot tell you, that is your answer.
Black Friday rewards urgency. Long-term investing rewards the opposite. The best deal available this November, or in any month, will never be advertised at a checkout: a regular, low-cost, diversified plan, left alone to do its work.
Start your plan
SCM Direct builds ISA, Junior ISA, SIPP and general investment portfolios using low-cost exchange-traded funds, with every cost disclosed upfront, and our founders invest their own money alongside our clients.
Because the funds trade daily, you can access your invested money if your circumstances change, although its value may then be lower than the amount invested; SIPPs and Junior ISAs are locked until a set age.
Portfolios start from £10,000 plus £200 a month. On the same illustrative 5% a year before charges, that combination could grow to around £107,700 over 20 years.
Take our FREE risk analysis test →
Gina Miller
Co-Founder SCM Direct
FAQ’s
What could £200 a month, invested, become over 20 years?
You would pay in £48,000. Before charges, tax and inflation, it could be worth around £58,800 at 2% a year, £81,200 at 5% or £113,800 at 8%. These are illustrations, not forecasts: real returns vary from year to year and can be negative.
How much difference do investment fees make over 20 years?
More than most people expect. On £200 a month growing at 5% a year before charges, paying 1.5% a year instead of 0.5% could cost around £7,900 over 20 years. That is more than three years of contributions.
Is it better to keep money in cash or invest it?
Cash suits short-term needs and emergency funds. Over longer periods, the question is whether savings keep up with rising prices. At 2% interest and 3.5% inflation, £200 a month saved for 20 years would buy around £29,600 in today’s money. The 5% illustration would be worth around £40,800. Investing carries risk, and you may get back less than you put in.
How much can I put into a Stocks and Shares ISA?
The ISA allowance is currently £20,000 per tax year, across all your ISAs. Growth and income inside a Stocks and Shares ISA are free of UK tax. Allowances and tax rules can change.
Can I access my money if my circumstances change?
SCM Direct portfolios use funds that trade daily, so ISA and general investment money can be withdrawn. Its value may be lower than you invested. Pension (SIPP) money is normally available from age 55, rising to 57 from April 2028, and Junior ISA money belongs to the child at 18.
What is the minimum investment with SCM Direct?
£10,000 as an initial investment, plus £200 a month. There is no maximum.
Do SCM Direct’s founders invest in the portfolios?
Yes. Alan and Gina Miller invest their own, joint and family money across all SCM Direct portfolios, on exactly the same terms and fees as clients.
Capital at risk. The value of investments, and any income from them, can fall as well as rise, and you may get back less than you invest. The figures in this article are simulated illustrations based on assumed growth rates. They are not forecasts, they do not represent any SCM Direct portfolio, and they are not a reliable indicator of future performance. Past performance is not a reliable indicator of future results. Tax treatment depends on individual circumstances and may change. SCM Direct is a trading name of SCM Private LLP, authorised and regulated by the Financial Conduct Authority (FRN 497525).