Financial markets reflect complex interactions of perception of value and reality in arriving at the price of investment assets at any given time.
Recent weeks have seen historic, stupefying political economic misjudgment that has resulted in volatility across the Gilt market – an asset class traditionally viewed as a ‘safe haven’ investment. One question is the ripple effect. Is the dysfunction experienced by the debt markets coming to the property market?
For many investors, the housing market has become a more intuitive choice for their pension planning, grounded on expectations of historic performance persisting into the future. Over the last 40 years, rising rates have been succeeded by falling average house prices on only two occasions. Over the two years following the peak in base rates, we have seen an average decline of 9.5% in property values.
In this blog, we examine the UK housing market – firstly, as rising house prices are a key determinant of the household ‘wealth effect’, i.e., when capital gains on paper encourage consumers to ‘feel rich’ and continue the spending which fuels economic growth.
Secondly, perceptions of wealth contribute to the overall ‘animal spirits’, as J M Keynes, the Nobel prize-winning economist put it. The overall confidence in the economy across the private and public sectors, both domestically and abroad.
Thirdly, the housing market is typically where the reality of global financial flows impacts upon day-to-day life, for example, as rising rates in the United States nudge the rest of the world higher. Central banks across the world are often compelled to follow suit in order to attract the capital which underpins national currency stability.
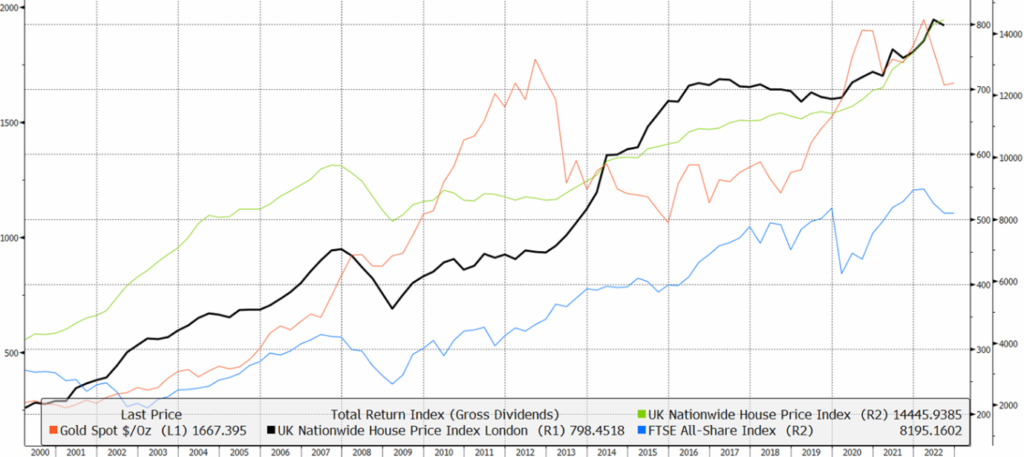
The chart above shows the absolute values of the London property (in black) and UK property (in green) market indices, since 2000, as measured by the popular Nationwide survey. One can see that property and UK stock market (as measured by the FTSE All-Share index in blue) rallied strongly after the Great Financial Crisis (GFC) of 2008, as the economy benefited from a sustained period of government stimulus. Notably, the housing market was relatively unaffected by the Covid Shock which afflicted the equity market in 2020.
Interestingly, investment in gold (the Dollar price per ounce is in orange) has been a volatile choice for those in search of stability, with the price falling back heavily over 2012-2015, as risk-taking became the dominant market trend. Thereafter, it surged to new heights as the Covid pandemic and Ukraine conflict environments triggered flights to perceived safety.
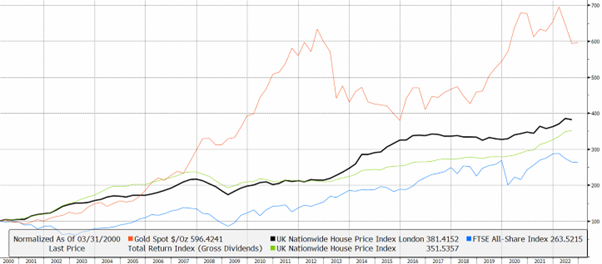
We can see some trends more clearly by normalising the data in the chart below, that is, by comparing the performance of asset classes from the same base value in 2000.
Comparing London and the broader UK property market reveals significant out-performance by the capital over the last 10 years, with the difference narrowing in recent years to deliver almost a 400% return over the longer term.
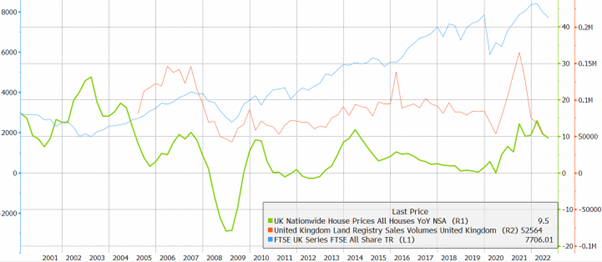
Turning to growth rates, the latest Nationwide figures (in green below) suggest 9.5% year-on-year, falling back slightly from the 10 year high reached earlier this year. Land registry sales volumes (in red) rose dramatically to triple from pandemic lows, with the last datapoint of 52.6k comparable with the aftermath of the Credit Crunch.
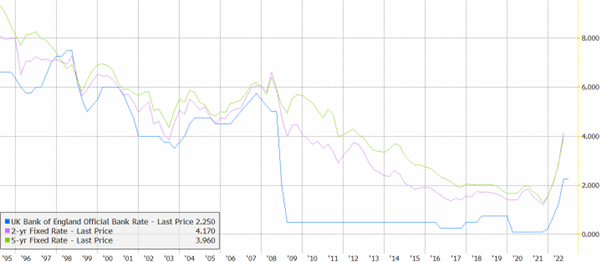
In arriving at a likely scenario for the direction of house prices, the relationship between the Bank of England base rate and mortgage rates is useful. The chart below depicts the close relationship between these rates until the drastic decoupling caused by emergency measures post GFC, with rates returning to highly correlated moves over the past 12 months.
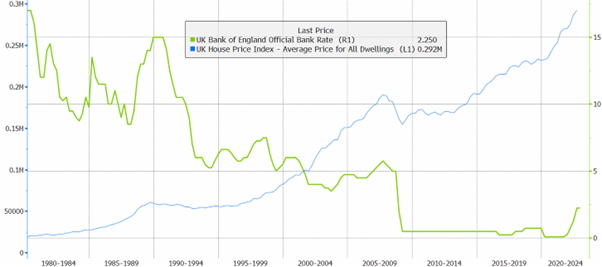
Examining the longer-term trajectory of base rates and the land registry house prices, see chart below, reveals there have been 8 interest rate tightening cycles since the early 1990’s.
Notably, only two of these rising rate environments coincided with declines in the average dwelling price, indicating both the resilience of housing, and the potential magnitude of correction when the property market falls.
In 1990, the base rate peaked at 15% resulting in a 5.9% fall in the average house price over the next two years, while 2007 saw rates reach 5.75% followed by a house price decline of 13.2% in the midst of the Credit Crunch.
Speculators on base rates are currently pricing in hikes from 2.25% towards a plateau of 5.1% in November 2023. Absent a major economic shock which impacts sentiment, debt service and affordability, comparable to the events described above, an average house price decline of 10% or more seems unlikely. However, with rising interest rates and inflation, and the pressure these exert on the UK consumer, the housing market is undoubtedly vulnerable to negative sentiment and further volatility.
It’s also clear from these charts that neither property nor gold have a consistent track record of avoiding significant losses over the longer term. The issue of timing is critical, especially when differences between the perception of value and reality can collide with unforeseen consequences.
Professional investors seek to navigate between the ‘right strategy’ at the wrong time, and the wrong strategy at the right time of action. At SCM, consistent and careful diversification is the golden approach designed to deliver a firm foundation of resilient returns in all weathers, avoiding over-concentration of portfolio investments in any given asset class.
Capital at Risk.
The value of investments can go down in value as well as up, so you could get back less than you invest. It is therefore important that you understand the past performance is not a guide to future returns. SCM Private does not give personal advice based on your circumstances. We aim to provide investors with understandable information so they can make fully informed decisions. If you are unsure about the suitability of our investment portfolios please contact an independent financial adviser.
SCM Direct is a trading name of SCM Private LLP which is authorised and regulated by the Financial Conduct Authority to conduct investment business No. 497525.
SCM Private LLP is a limited liability partnership registered in England and Wales No. OC342778.