“There is a tide in the affairs of men, which, taken at the flood, leads on to fortune.” – Shakespeare, Julius Caesar.
It’s often observed that the natural and financial worlds follow, to a lesser or greater extent, cycles of behaviour, be it risk-taking succeeded by risk aversion, greed yielding to fear.
Many market participants exert considerable computing resources to identify underlying patterns with explanatory power to assist investment decision-making.
In this vein, here’s a thought-provoking question – what might connect these world-changing events?
- The 1815 Battle of Waterloo and the 1917 Russian Revolution.
- Putin’s 2022 Invasion of the Ukraine and Hitler’s 1938 Invasion of Sudetenland, Czechoslovakia.
- The 1861 American Civil War and the 1973 Arab Israeli War.
- The 9/11 Atrocity of 2001 and the 1987 Black Wednesday Crash.
- The 1945 Hiroshima Bombing and 2008 Great Financial Crisis.
- The 2015 Chinese Stock Market Crash and 1994 Bond Market Crisis.
Remarkably, all twelve of these notable historical moments are on the same seven-year sequence: 2022, 2015, 2008, 2001, 1994, 1987 etc. Suffice to say, this pattern could be an interesting coincidence or a good example of ‘data mining’, that is, hunting for evidence to justify a speculative notion.
Focussing on the present circumstances, it’s worth turning our attention to some indisputable facts of the global economy impacting every investment portfolio: debt and inflation.
Debt Cycles
The US has long been the favoured destination and driver of global capital flows. It is still the largest economy and exceptionally based on consumption, where the world’s manufacturers and exporters come to sell their wares.
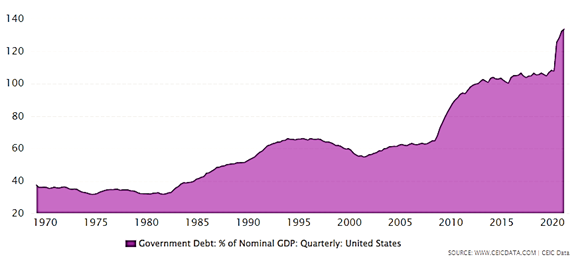
As such, examining the amount of debt in proportion to the nation’s wealth, or Gross Domestic Product (GDP) serves to illustrate the centrality of this rising tide to support a growth story over the post-war decades which persists to the present day.
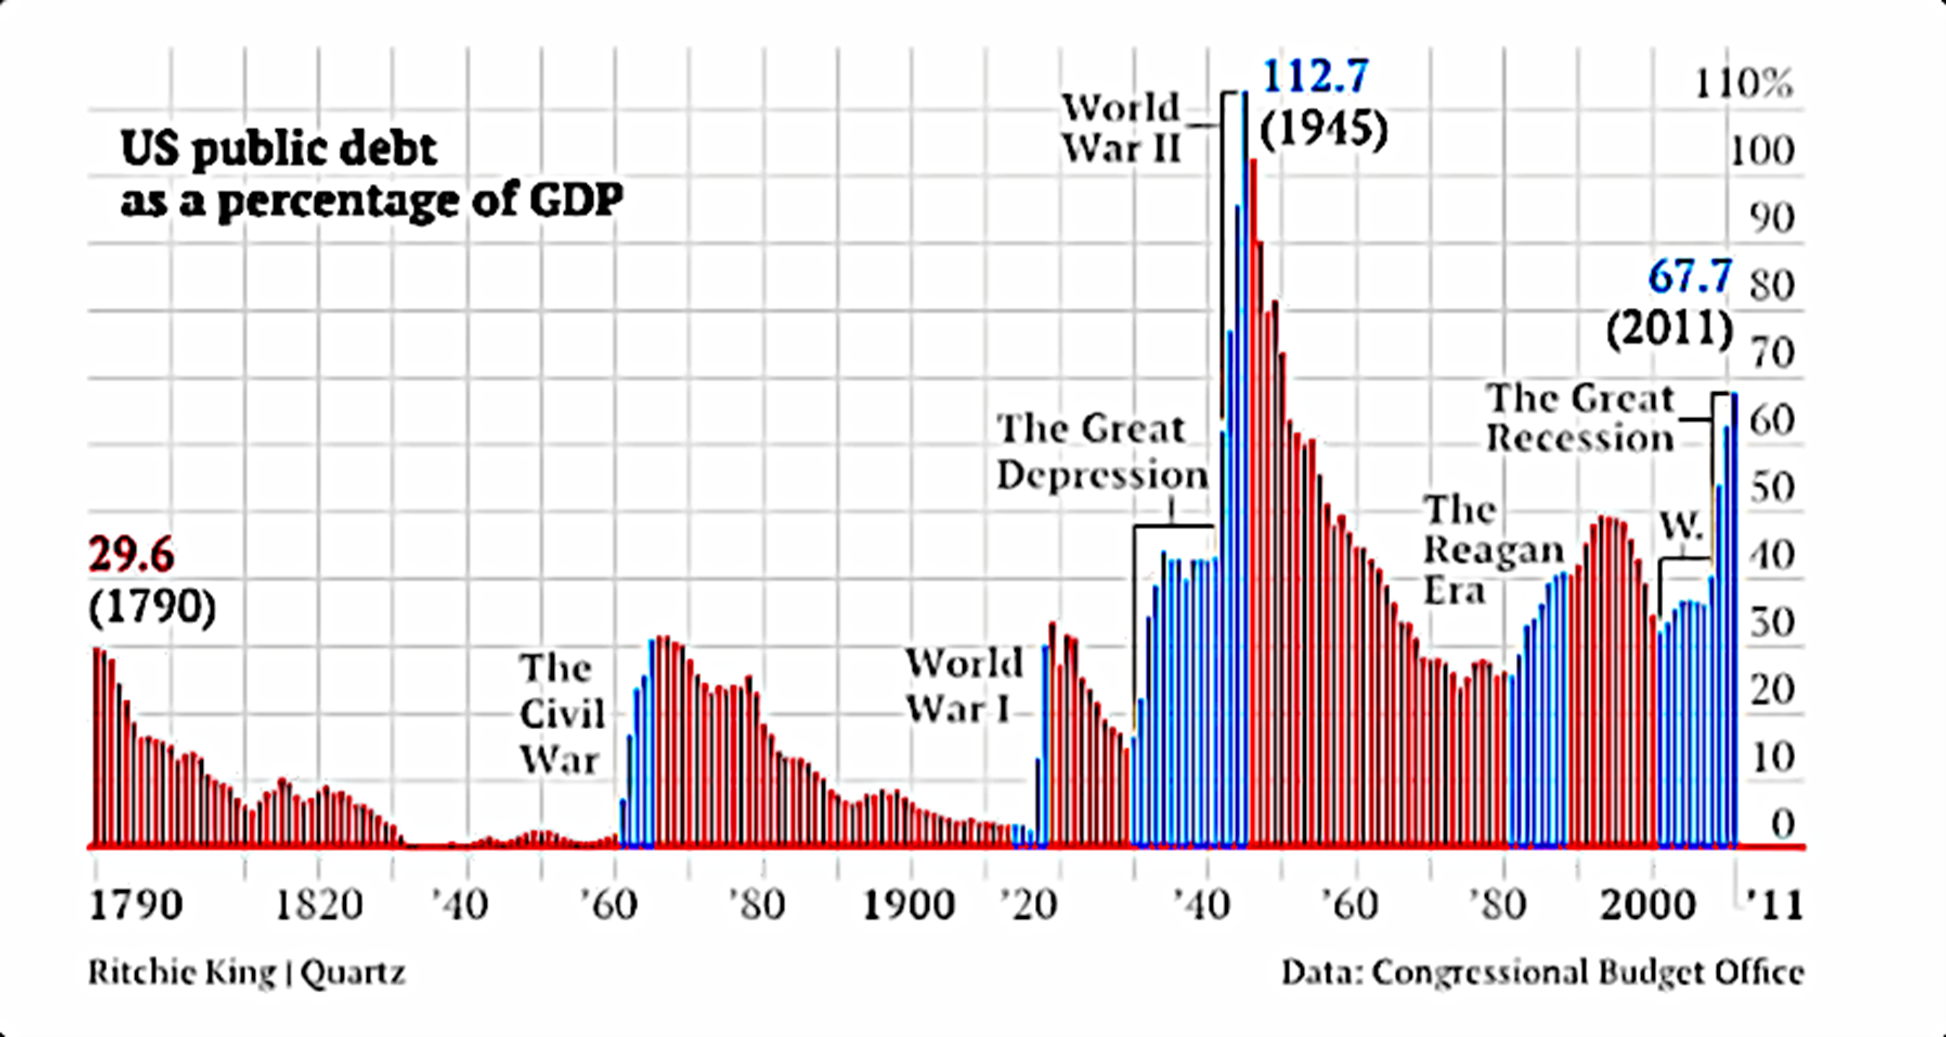
Considering the much longer-term, adds more ebb and flow to the picture. The chart below illustrates that current the level of US government borrowing, at 120%, is comparable to the 1940s.
The absolute magnitude of debt is much less important than the federal authority’s commitment and ability service the interest, which remains steadfast for the foreseeable future.
During last year’s period of market stress precipitated by hostilities in Eastern Europe, the dollar strengthened, and overseas capital sought out the safe haven of US equity and debt assets.
Inflation Cycles
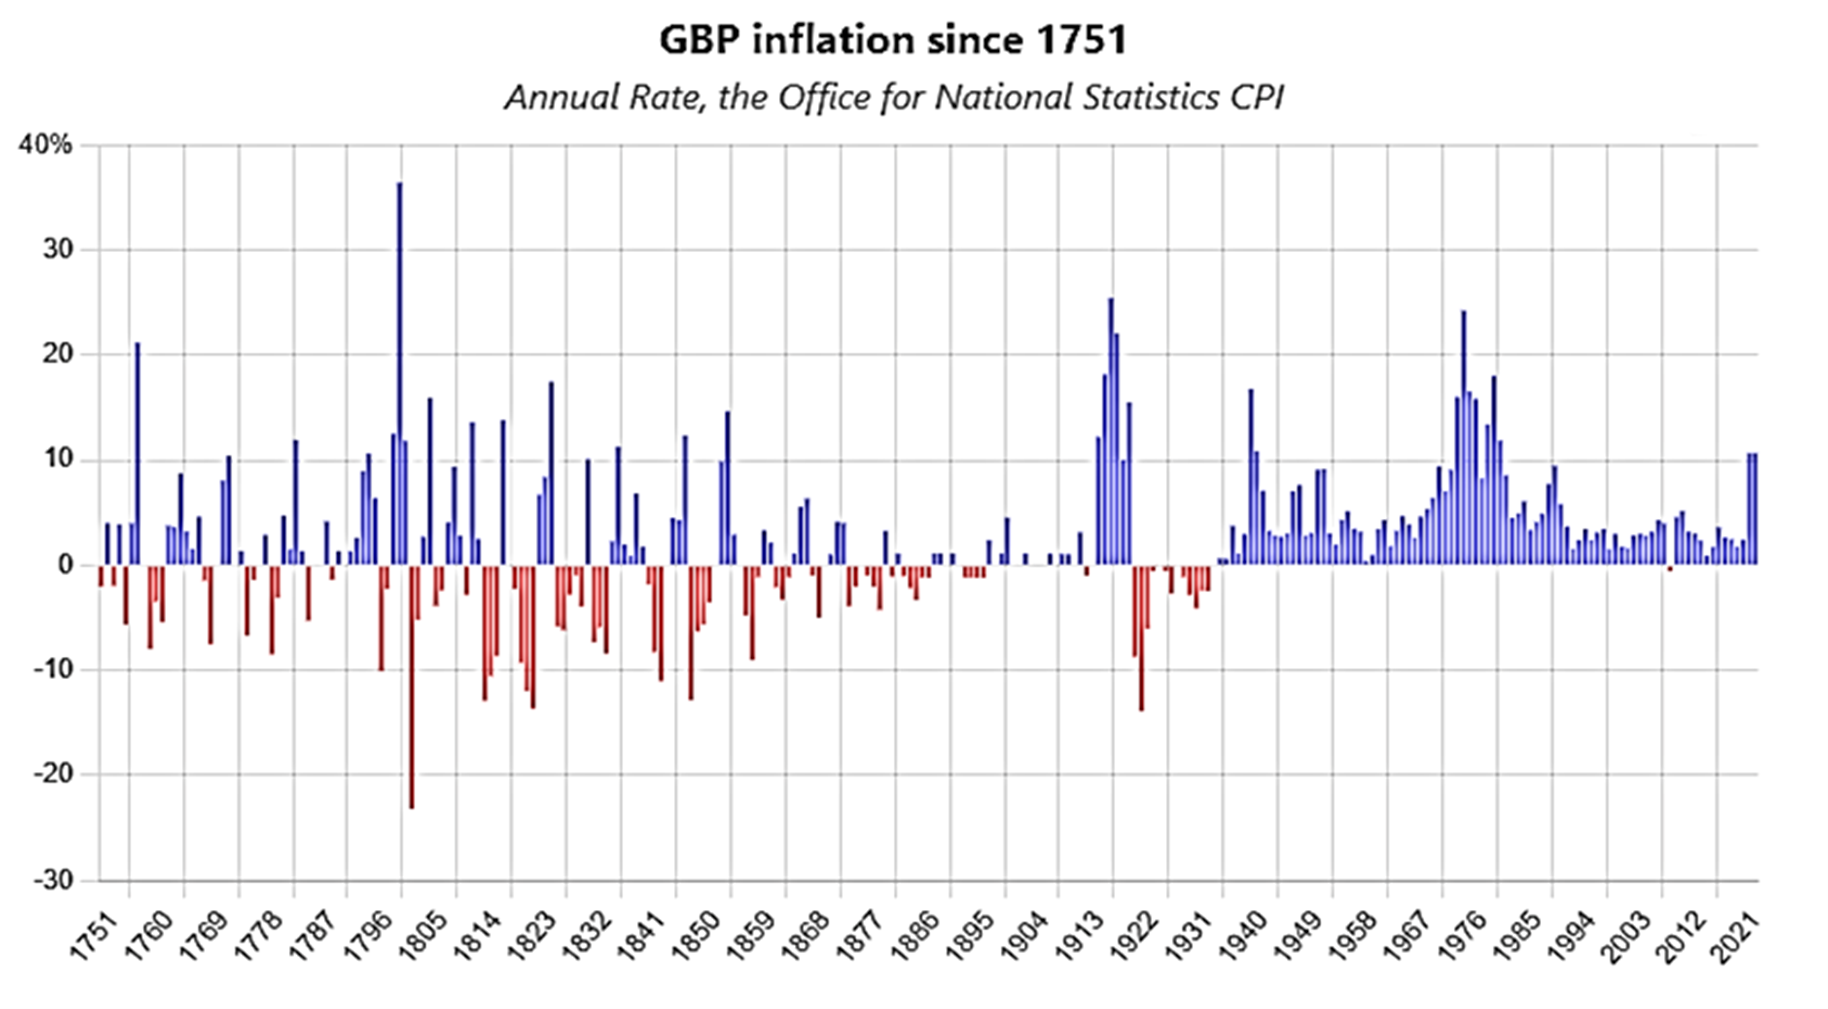
Closer to home, inflation concerns abound, as the UK rate of price increases is currently at levels not seen since the 1910s, 1940s and 1970s. In the light of the above charts, the graph below confirms the observation that conflict, borrowing and inflation often go in hand in hand.
For our SCM Direct Portfolios, in the UK domestic environment of low economic growth and high inflation, sometimes described as ‘stagflation’, we favour a thoroughly researched and proven strategy of balanced exposure to wide range of equities and bonds across the globe. In particular, emerging markets are supported by high population growth, strong commodity prices and technological innovation.
Returning to our quote from one of the Bard’s most famous history plays, unfortunately, things didn’t end so well for Brutus. Similarly, appropriate timing, execution and an exit strategy can be challenging even for the best of investment professionals. However, we’re confident of far better outcomes for our clients, especially given our track record against our peers.
From the perspective of seven-year cycles, if the historic pattern holds true, the next hotspot looks to be some distance away in 2029. SCM is determined and diligent in seeking to keep your wealth highly diversified, your costs at a minimum and remains constantly vigilant, looking for attractive investment opportunities.
Capital at Risk.
The value of investments can go down in value as well as up, so you could get back less than you invest. It is therefore important that you understand the past performance is not a guide to future returns. SCM Private does not give personal advice based on your circumstances. We aim to provide investors with understandable information so they can make fully informed decisions. If you are unsure about the suitability of our investment portfolios, please contact an independent financial adviser.
SCM Direct is a trading name of SCM Private LLP which is authorised and regulated by the Financial Conduct Authority to conduct investment business No. 497525.
SCM Private LLP is a limited liability partnership registered in England and Wales. No. OC342778.