The Coronavirus pandemic has intensified debates about the interconnectedness of society, health, sustainability, corporate behaviour and our financial system, including how we invest our money. And whether chicken or egg, investors are actively seeking ESG products as data from The Investment Association, which represents the funds industry, shows that more than a quarter of the UK’s assets under management are invested using a socially responsible strategy of some kind. This trend of investors piling unprecedented levels of savings into sustainable funds has resulted in asset managers jumping on the bandwagon and rushing to launch new products, with predictions that ESG is one of the most important consumer shifts in the investment industry for generations. But how sturdy is the bandwagon? The reality behind the rhetoric is that they could be taking investors seeking to align their morals with their money into cowboy territory.
SCM Direct published our first report into ESG funds in November 2019 entitled ‘Misclassification and Mis-selling of Ethical Funds’ which found that there was a greenwashing epidemic, and we had hoped things would improve. But our latest research exposes that behind the glossy advertising, rousing words, what many would consider to be ‘sin stocks’ are still being wrapped up in sustainable green credentials. The scoring systems are nonsensical, third party data providers operate with no benchmarks, and the lack of transparency makes it impossible for ethical investors to know where their money is really invested.
We are strong believers in the reallocation of funds towards sustainable investments and companies who can contribute to a better future, but until the industry starts catching up with demand in terms of rules and regulations, there needs to be an urgent means of protecting investors. The simplest and most effective solution would be for the regulator to mandate 100% transparency of holdings online not least because my idea of a sin stock might be very different to yours. If SCM Direct can do this for our Ethical/ESG Portfolio every month, why can’t others?
The vast numbers of investors, especially new investors, piling into sustainable ESG/Ethical funds will be hoping that their money gets good returns as well as does good. An astonishing 84% of all new capital allocated to funds investing in equities since 2019, has gone into ESG specific products.[1] But new research from SCM Direct exposes comparatively small differences between these investment products and more mainstream investments.
The main culprit is the poor quality of data available that can be reliably used by fund managers. The main source of data is often self-certification when fund managers send questionnaires to a particular company, but never know if that company’s answers maybe economical with the truth, or alternatively use one of the many third party independent ESG data providers, whose scores often make no sense, can be completely different between providers for the same company and which often do not seem to match what investors might expect. There are no set industry benchmarks so it is almost impossible to make comparisons of scores between one provider and another.
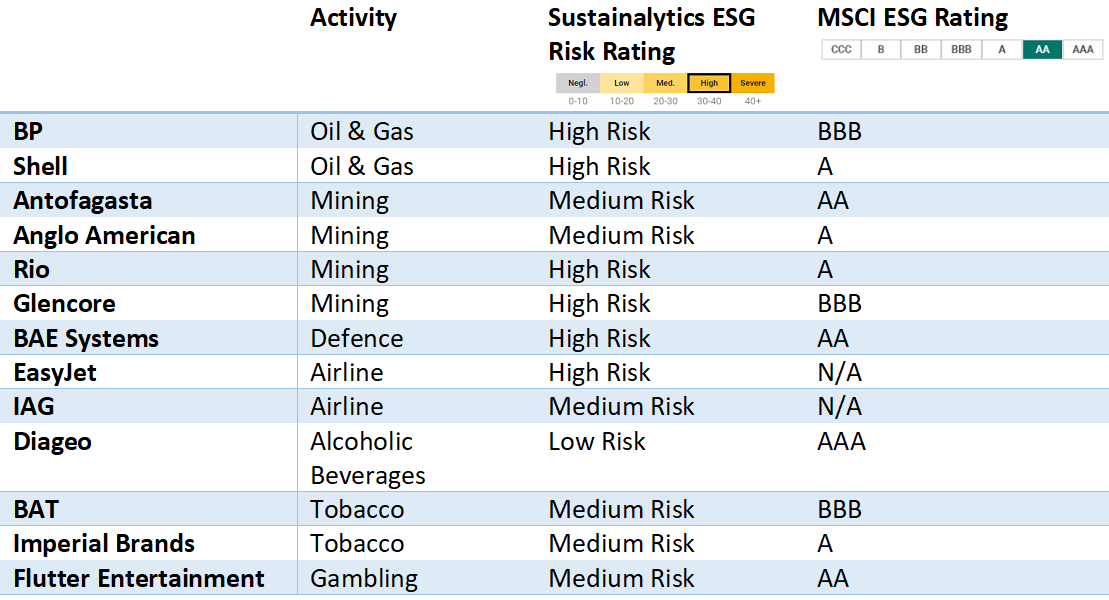
For example, two of the main data providers for these ESG scores are Sustainalytics[2] (owned by Morningstar) and MSCI[3]. They both look not just at the ESG scores for the companies but how well they manage such risks to arrive at an overall score. SCM Direct looked at their overall ESG scores for some of the FTSE 100 stocks which because of the areas in which they focus – oil& gas, mining, tobacco, defence, alcohol and gambling, might all be deemed high ESG risk, but the results were astonishing. Investors might logically expect that the stocks involved in mining, airlines, gambling, oil & gas, and alcohol would automatically be considered ESG high risk but that was not always the case, and the results were very different between one data provider and another.
The ESG data providers[4] look at numerous data items such as CO2 footprint, boardroom diversity, and many other factors to create an overall Environmental or Social or Governance score. For example, MSCI[5] ‘assesses thousands of data points across 37 ESG Key Issues’ which include carbon emissions, water stress, toxic emissions, labour management, health and safety, Board, pay, business ethics etc. But MSCI rates these metrics against the other companies in the same industry so you can end up with what many would regard a ‘bad’ industry e.g., Tobacco but with many of the companies still getting a good score as they are better than other tobacco companies. In the case of Sustainalytics[6], scores ‘are absolute, meaning that a ‘high risk’ Assessment reflects a comparable degree of unmanaged ESG risk across all subindustries covered. This means that a bank, for example, can be directly compared with an oil company or any other type of company.’
If you look at some of the well-known FTSE 100 stocks you can find some very surprising results:
Sustainalytics Vs MSCI Risk Ratings for various FTSE 100 stocks
FTSE 100 Stocks
International Stocks
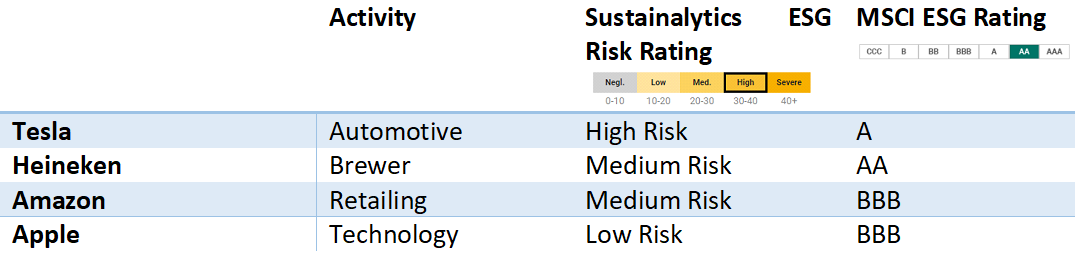
Why the differences between data providers on say Tesla? Currently, Sustainalytics ESG Risk Score is 31.1[7] which is classified as ‘High’ as whilst Tesla has a very good Environmental Risk Score, it’s Social Risk and Governance Scores are not so good and its ‘controversy level’ is described as ‘significant’ related to governance and employees. Its notable material ESG issues are product governance, human capital and carbon products. MSCI rates Tesla as ‘A’ against its peers in the automobile industry even though it deems it a laggard in Labour Management and (surprisingly) a leader in Corporate Governance.
Within Ethical funds, the results are even more surprising.
Ethical fund managers set their stall out to investors as ensuring that the various stocks they hold in their carefully screened, analytically robust actively managed ESG funds would have much higher ESG scores than their company’s mainstream funds. The SCM Direct research tells a very different story.
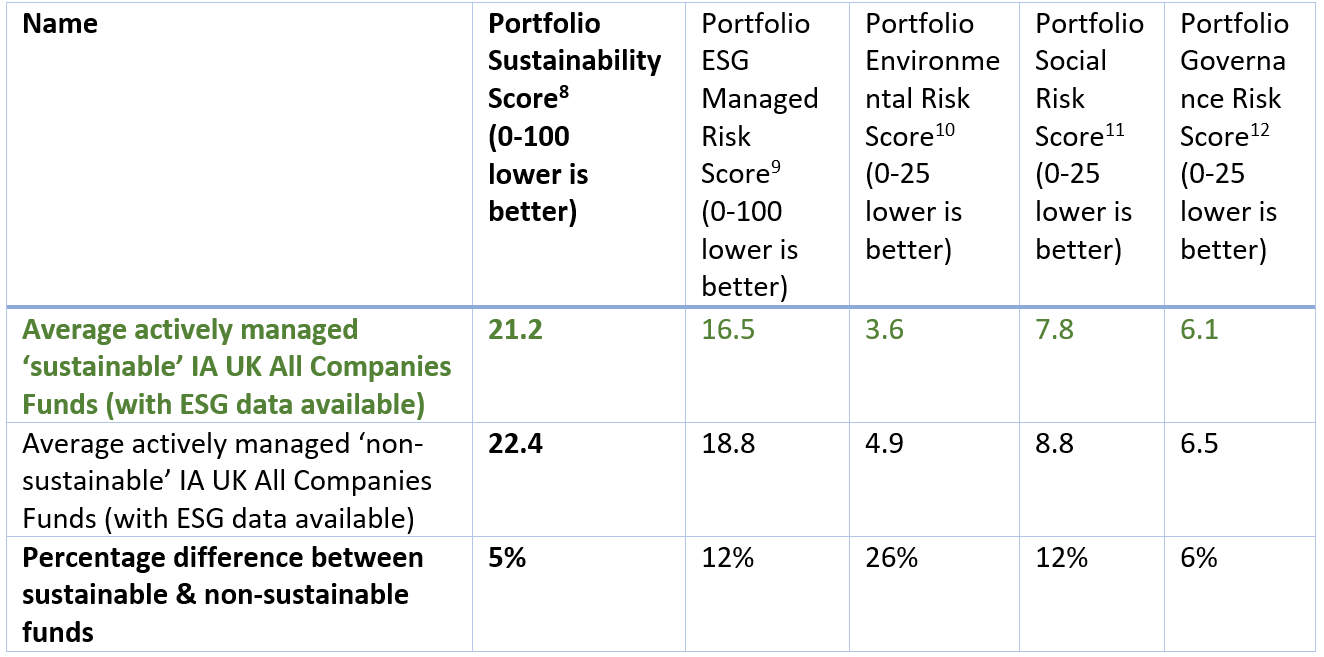
SCM analysed 194 UK registered, actively managed, sustainable funds, with total assets of £99 Billion that were all classified as ‘UK All Companies’ funds by the Investment Association.
We then compared the 16 funds classified as ‘sustainable’ with the other 178 funds. The sustainable funds were better in terms of their overall latest asset weighted sustainability score by just 5% compared to non-sustainable competitors. Within this score which reflects how well they are managing their risks and the actual E, S & G risks – the differential was the highest in terms of their Environmental credentials.
As the table above shows, only two of the 16 – Aegon Ethical Equity and the popular Royal London Sustainable Leaders – appear in the top ten sustainability scores within the 194 funds analysed, based on Sustainalytics’ data. But even these two are beaten by mainstream funds such as Lindsell Train UK Equity and Franklin UK Mid Cap, in terms of sustainability. For example, Lindsell Train UK Equity gets the highest Morningstar Sustainability Rating even though it is not specifically a sustainable investment focused fund. However, it holds 9.7% in Diageo (alcoholic beverage) and 5.9% in Heineken (alcoholic beverages).[13]

Funds in green are marketed as sustainable/ethical/ESG funds – the others are not. *The lower the Sustainalytics Sustainability Score, the more sustainable-friendly the fund’s holdings
In summary, the difference between ESG and non-ESG funds is very small, and the scoring systems do not appear to match a typical investor’s expectations. When you consider people’s personal interpretations in terms of what one person considers ethical, compared to another, the only pragmatic and simple to understand solution is to mandate that all fund managers publish 100% of their holdings either monthly or quarterly.
This is the only way to grant investors the basic consumer right of knowing what they are really buying – in this case, if their money is truly aligning with their morals.
Footnotes
- https://citywiremiddleeast.com/news/esg-funds-attract-84-of-global-equity-inflows-since-2019/a1483009?assetClassID=16
- https://www.sustainalytics.com/esg-ratings/
- https://www.msci.com/our-solutions/esg-investing/esg-ratings/esg-ratings-corporate-search-tool
- https://www.msci.com/eqb/methodology/
- https://www.msci.com/eqb/methodology/meth_docs/
- https://connect.sustainalytics.com/
- https://yourgreenwealth.com/esg/is-tesla-sustainable/
- ‘The Morningstar Portfolio Sustainability Score is an asset-weighted average of Sustainalytics’ company-level ESG Risk Score. The Sustainalytics’ company-level ESG Risk Score measures the degree to which a company’s economic value may be at risk driven by ESG factors. Like the ESG Risk Scores, the Portfolio Sustainability Score is rendered on a 0-100 scale, where lower scores are better, using an asset-weighted average of all covered securities. To receive a Portfolio Sustainability Score, at least 67% of a portfolio’s assets under management (long positions only) must have a company ESG Risk Rating. The percentage of assets under management of the covered securities is rescaled to 100% before calculating the Portfolio Sustainability Score.
- ‘The asset-weighted average of the company managed ESG risk scores for the covered holdings in a portfolio. Company managed ESG risk Scores from Sustainalytics measure the degree to which a company effectively manages risk driven by ESG issues. ESG issues must have a potentially material impact on the economic value of a company to be measured. The managed ESG risk scores are displayed as a number between 0 and 100.’
- ‘The asset-weighted average of the Company Environmental Risk scores for the covered holdings in a portfolio. Company Environmental Risk Scores from Sustainalytics measure the degree to which a company’s economic value may be at risk driven by environmental factors. The environmental risk represents the unmanaged environmental risk exposure after taking into account a company’s management of such risks. The Environmental Risk Scores are displayed as a number between 0 and 100, though most scores range between 0 and 25.’
- ‘The asset-weighted average of the Company Social Risk Scores for the covered holdings in a portfolio. Company Social Risk Scores from Sustainalytics measure the degree to which a company’s economic value may be at risk driven by social factors. The social risk represents the unmanaged social risk exposure after taking into account a company’s management of such risks. The Social Risk Scores are displayed as a number between 0 and 100, though most scores range between 0 and 25.’
- ‘The asset-weighted average of the company Governance Risk Scores for the covered holdings in a portfolio. Company Governance Risk Scores from Sustainalytics measure the degree to which a company’s economic value may be at risk driven by governance factors. The governance risk represents the unmanaged governance risk exposure after taking into account a company’s management of such risks. The Governance Risk Scores are displayed as a number between 0 and 100, though most scores range between 0 and 25.’
- https://www.lindselltrain.com/~/media/Files/L/Lindsell-Train-V2/reports/lt-uk-fund/LTUK_Latest.pdf
Capital at Risk.
The value of investments can go down in value as well as up, so you could get back less than you invest.