It is always dangerous to stick your neck out, especially in the world of investing, but as a contrarian, I firmly believe now is a good time to buy both bonds and equities. At the time of writing (12 May 2022) the FTSE 100 has just fallen a further 2.5% on the day, following sharp falls in the US on disappointing inflation numbers.
It is interesting to see that at present most commentators and investment professionals seem to be universally bearish on most things – inflation, interest rates, recession, Ukraine, bond yields. Almost everything is seen through 100% dark rather than the usual rose-tinted glasses. Not surprising given faith in central bankers to guide us is not helped by their sloth-like track record in terms of reacting early in terms of interest rate rises and Quantitative Tightening (QT) when the economy was booming rather than stagnating.
Even our completely inept Bank of England Governor, Mr Bailey has spotted those sharp rises in interest rates when the consumer is already having to cope with a myriad of other increases and the government has a huge debt burden to finance, may not be helpful. Like a stopped clock, even Mr Bailey can get the time right occasionally.
As Warren Buffet famously said: ‘In the short run, the stock market is a voting machine. Yet, in the long run, it is a weighing machine.’ At the moment it is voting to get out of most things, rather than weighing the attractiveness of many assets following their falls.
I’m not a raging bull, but here are eight charts that indicate the markets would appear to be discounting a lot of bad news already:
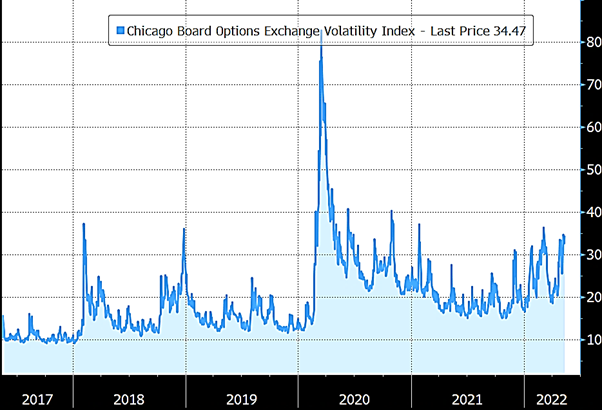
1. The Fear Index (VIX Index) is high – the VIX index measures the expected level of price fluctuation in the S&P 500 Index options over the next 12 months – it is currently almost the highest it has been since the start of the covid epidemic, indicating investor nervousness:
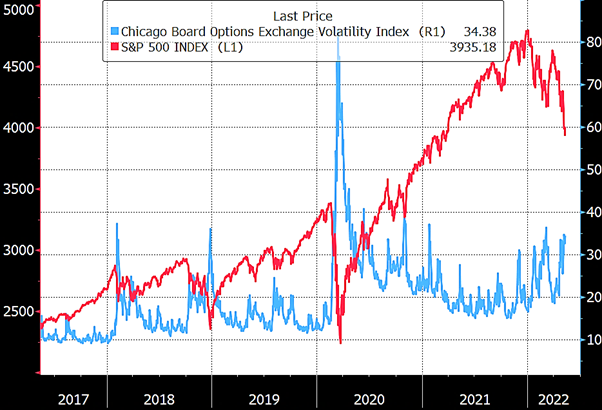
Often there is an inverse (short-term) relationship between VIX and the market – as fear resides the market tends to produce significant returns:
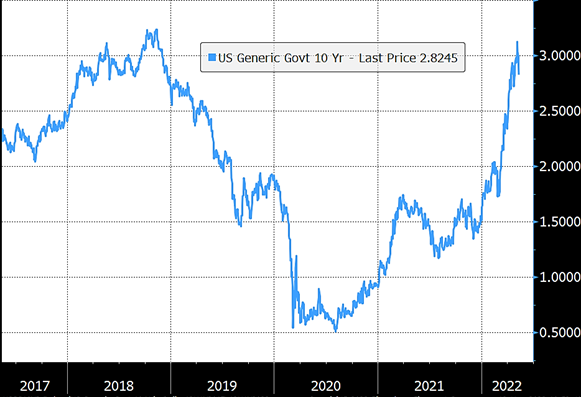
2. The sharp rise in US treasury yields now appears to be stabilising – have risen to above 3% per annum over 10 years now below 3% again despite many commentators who make their predictions seemingly using a ruler and little else, predicted yields rising to 4% or even 5%. Recently the 10-year yield has actually fallen slightly:
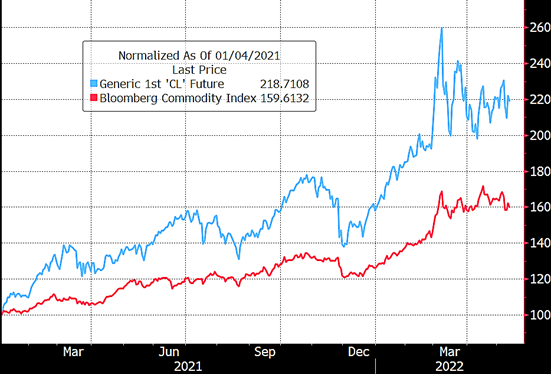
3. Oil price and commodities prices generally starting to stabilise – albeit they are still at elevated levels:
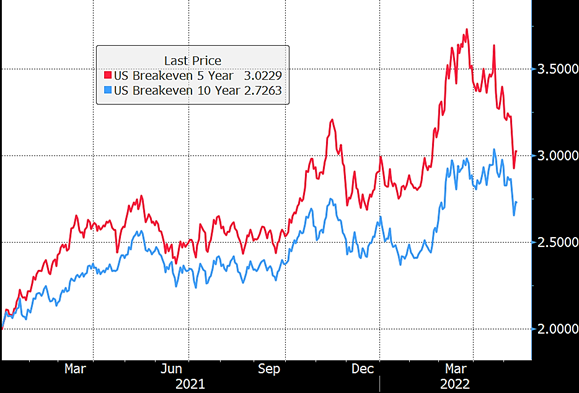
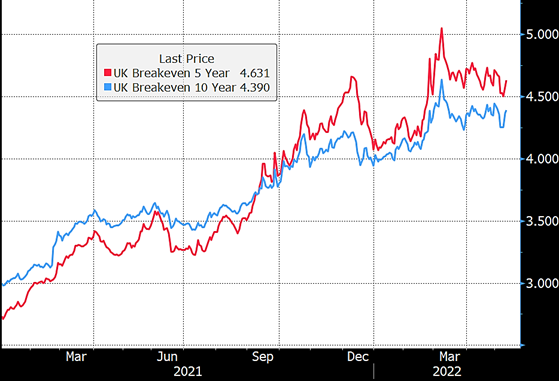
4. Market expectations (in the US) for future inflation now starting to come back, be it over the next 5 or 10 years:
Even the UK is coming back slightly:
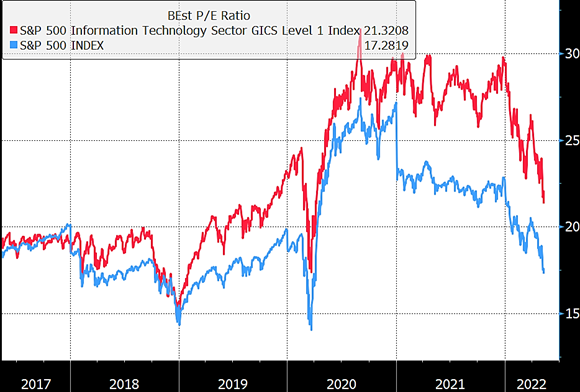
5. US Equities and US tech valuations back to 2019 levels:
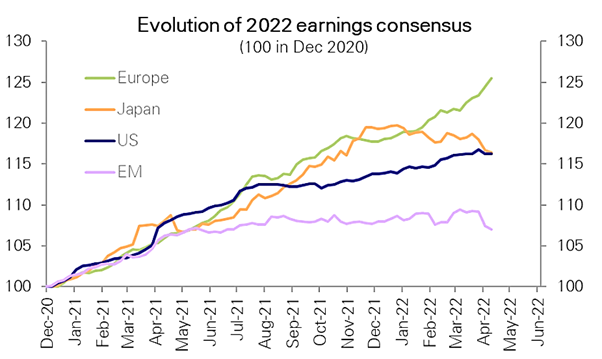
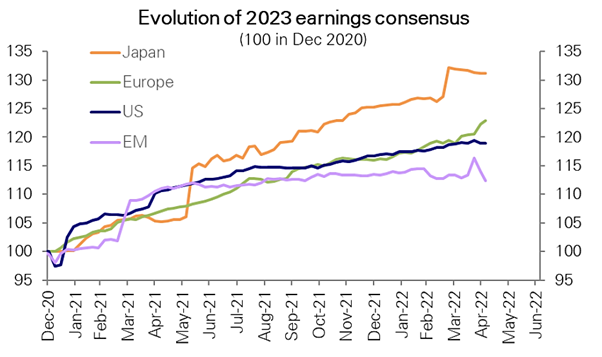
6. Corporate earnings forecasts (maybe surprisingly) have held up well – particularly in Europe:
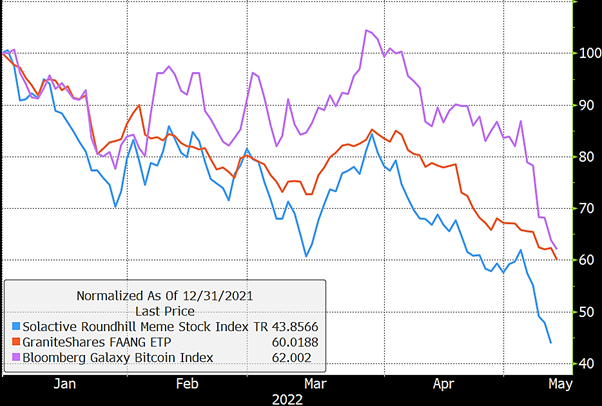
7. Hot money bubbles have now collapsed – Many of these have fallen around 50% this year e.g., FAANG stocks (Facebook, Apple, Amazon, Netflix, Google), meme stocks (companies that have gained a cult-like following online and through social media platforms) and Bitcoin – SCM Direct has very low exposures to any of the these ‘assets’:
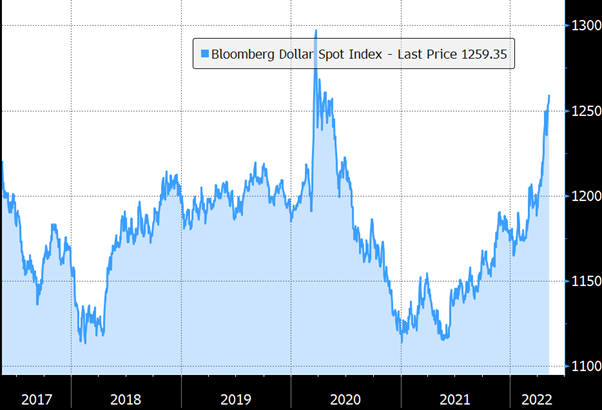
8. Can the US dollar really rise much more from current levels? – Many assets e.g., emerging equities and bonds look extra-ordinarily cheap but have suffered from the spike in the US Dollar. How sustainable is the US Dollar at current levels, which are close to their early covid peak?
Viewing G10 currencies on the basis of Purchasing Power Parity (PPP) – an economic theory that compares different countries’ currencies through a “basket of goods” approach. For example, if you compare the price of a big mac in different markets, you can see most major currencies look very undervalued against the US$:
PPP (Big Mac):

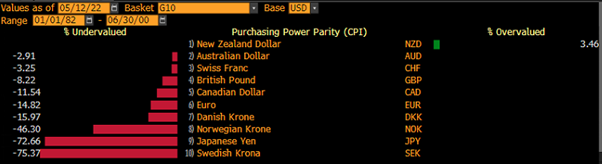
The same applies for other Purchasing Power Parity measures of the US$.
PPP (CPI – Consumer Prices Index):
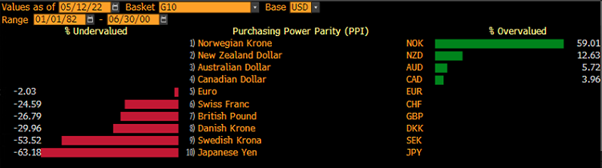
PPP (PPI – Producer Prices Index):
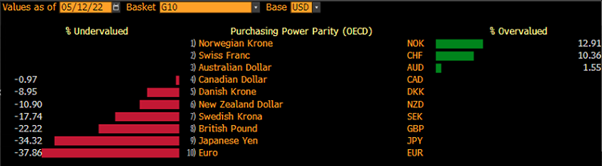
PPP (OECD):
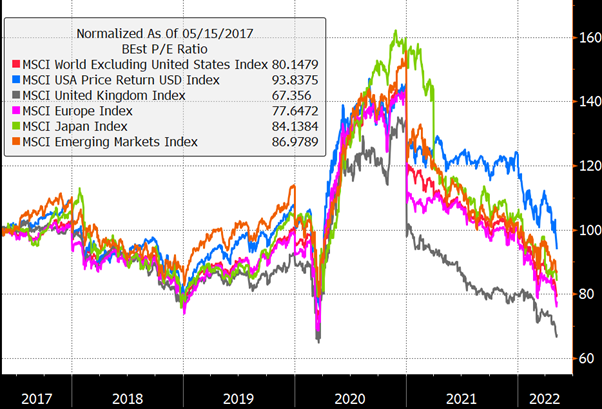
9. Compared to five years ago, the average P/E ratios have fallen in every major market ranging from 6% lower valuation in the US to 33% lower in the UK:
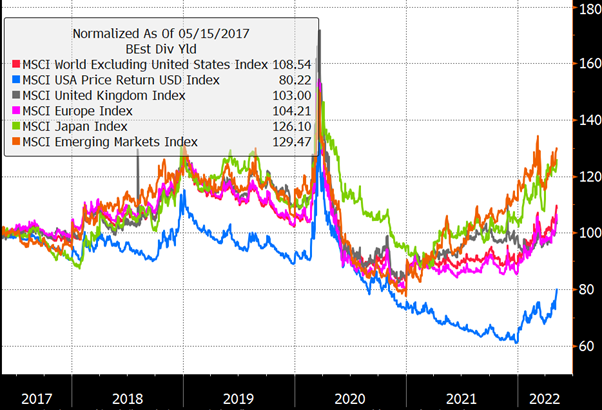
Whilst the dividend yields (outside the US) have risen significantly, particularly in emerging markets and Japan (two assets we like):
Conclusion
It is only in retrospect can you be 100% know if you have hit market tops or bottoms.
What we do know is that the market tends to over-react in both directions, and when sentiment is very negative (like at present), if you can stomach the higher volatility and have a degree of patience, you tend to be well rewarded.
Now is one of those times in my view.