Overview
To substantially outperform cash whilst aiming to reduce downside risk. Please note that whilst we aim to achieve positive returns over three-year rolling periods, there is no guarantee that such a return will be achieved over this or any other period.
Actively managed and may be all equity, all bonds or all cash. It normally invests in a wide range of ETFs to gain significant diversification and exceptional liquidity at very low cost.
| Stock Short Name | Percentage of Portfolio |
|---|---|
| VANGUARD INV SER-UK GILT UCITS ETF | 11.6 |
| iShares Core UK Gilts UCITS ETF | 11.3 |
| iShares Core MSCI EM IMI UCITS ETF | 11.2 |
| Amundi UK Equity All Cap UCITS ETF | 8.8 |
| iShares Core FTSE 100 UCITS ETF | 7.8 |
| SPDR Sterling Corporate Bond UCITS ETF | 6 |
| SPDR Bloomberg 15+ Year Gilt UCITS ETF | 5.6 |
| ISHARES II PLC-USD FLTG RATE BOND U | 5.3 |
| Amundi MSCI Japan UCITS ETF | 5 |
| iShares Core £ Corp Bond UCITS ETF | 4.4 |
| Number of Holdings | Yield to Maturity | Maturity | Duration | S&P Rating |
|---|---|---|---|---|
| 137 Govt. Bonds 1,693 Corp. Bonds | 4.83% | 9.69 | 6.28 | A/A- |
| Number of Holdings | Best Dividend Yield Forward 12m | Best Price to Book Forward | Best P/E Ratio | Best LTG EPS |
|---|---|---|---|---|
| 7,425 | 3.1% | 2.1 | 13.6 | 13.4% |
| Absolute Return | 6.5% |
|---|---|
| Asia Pacific Ex. Japan (MSCI Asia Ex Jap) | 18.9 |
| Em Markets (MSCI EM) | 17.8 |
| Japan (MSCI Japan) | 14.5 |
| US Equities (MSCI USA) | 13.2 |
| Europe Excl UK (MSCI Eur. Ex UK) | 11.5 |
| UK Equities (MSCI UK) | 9.6 |
| UK Index-Linked Gilts (Barclays UK Infl Linked) | 8.9 |
| UK Gilts (Bloomberg UK Govt All>1 Yr) | 6.9 |
| UK Corp Bonds (iBoxx Large Cap TRI Index) | 5.1 |
Performance is based on the monthly performance of the first client discretionary portfolio after all charges. Individual client portfolios may differ due partly to differences in the timing of initial investment or withdrawals or rebalancing. The SCM Absolute Return (GBP) Benchmark is the Barclays Benchmark Overnight GBP Cash Index. Competitor data is based on the performance of the IA Targeted Absolute Return Sector and the comparison is offered as a guide only.
| 12m to 30/06/2021 | 12m to 30/06/2022 | 12m to 30/06/2023 | 12m to 30/06/2024 | 12m to 30/06/2025 | 12m to 30/06/2026 |
|---|---|---|---|---|---|
| 15.1% | -9.2% | 4.6% | 10.6% | 6.4% | 14.9% |
Source: SCM Private LLP
| ALL Fees & Charges | Percentage |
|---|---|
| SCM Discretionary Fund Management Charge | 0.40% |
| Underlying ETF costs (KIID Ongoing Charge) | 0.14% |
| Transaction Costs of buying/selling funds | 0.12% |
| Transaction Costs within funds | 0.04% |
| Custody & Administration Fee | 0.12% |
| Total Fees & Charges | 0.82% |
In June, we made no changes to the SCM/MoneyShe Portfolios. The rotation into UK government bonds we completed in May continued to do its work quietly; the more interesting action was elsewhere.
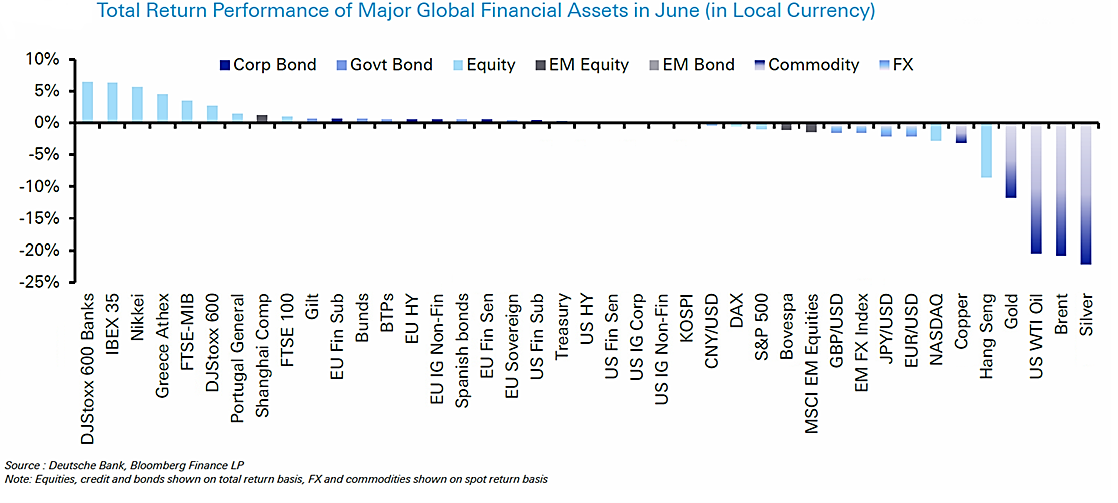
The interim US-Iran peace agreement held through the month, and Brent crude fell a further 20.8%, ending June at $72.92 a barrel – almost exactly where it stood before the conflict began. As the war premium drained from oil, stagflation fears receded, gilts continued to recover, and the FTSE 100 closed at a record high of 10,573. Yet beneath the calm, June produced the sharpest rotation of the year.
The table below shows how June’s winners and losers stack up across the world’s major assets – a reminder of how quickly market leadership can change, and why we prefer to own the haystack rather than guess at needles.
SpaceX, one month on
In our recent blog we discussed the mid-June flotation of SpaceX, the largest listing in history, instantly valued at around $2.75 trillion, and asked how much optimism was already embedded in the market’s most fashionable assets. June offered a partial answer. Investors began to question the returns on the vast sums committed to AI: Microsoft fell 17% and Oracle 35% over the month, the Nasdaq lost 2.7%, and the ‘Magnificent 7’ is currently up just 4% this year. The money did not leave markets; it simply moved into banks (European bank shares rose over 6% in June), healthcare and industrials. It is interesting to note Apple’s decision to raise the prices of iPads and Macs by almost 20% because of a shortage of memory chips. The AI build-out is no longer just showing up in share prices, it is showing up in the price of the things we all buy. Concentration cuts both ways: the same handful of names that drove markets higher for two years can just as easily lead them lower, which is why we spread our investments so widely.
Hawks everywhere
Central banks turned hawkish in unison in June. The ECB delivered its first rate hike since 2023 – ‘completely warranted and justified’, in Christine Lagarde’s words – and the Bank of Japan raised rates to 1%, yet the yen still fell to its weakest level since 1986. The dollar rose for a fourth consecutive quarter, boosting overseas returns for UK investors. Futures markets, which began the quarter pricing Federal Reserve cuts, ended it pricing nearly 40 basis points of hikes. At home, services inflation rose to 3.7%, and the Bank of England’s June hold came with two votes for an increase. Gold, supposedly the ultimate hedge, fell 16.9% in June alone; we continue to hold none, preferring assets that pay us to wait. Events since month-end, including the end of the fragile ceasefire and a rebounding oil price, reinforce our view that the inflation genie is not yet back in the bottle.
SCM Portfolios
Our portfolios continue to perform strongly against both our peers and their benchmarks in June. The rotation into UK government bonds, made when yields were above 5%, continues to reward patience, while our refusal to chase fashionable assets – no gold, no bitcoin, no concentrated technology bets – was vindicated in a month when all three stumbled. Unglamorous months like this are exactly what genuine diversification is for.
We remain focused on capital preservation, valuation discipline and global diversification, and continue to monitor developments very closely.
Alan Miller, Chief Investment Officer
15 July 2026